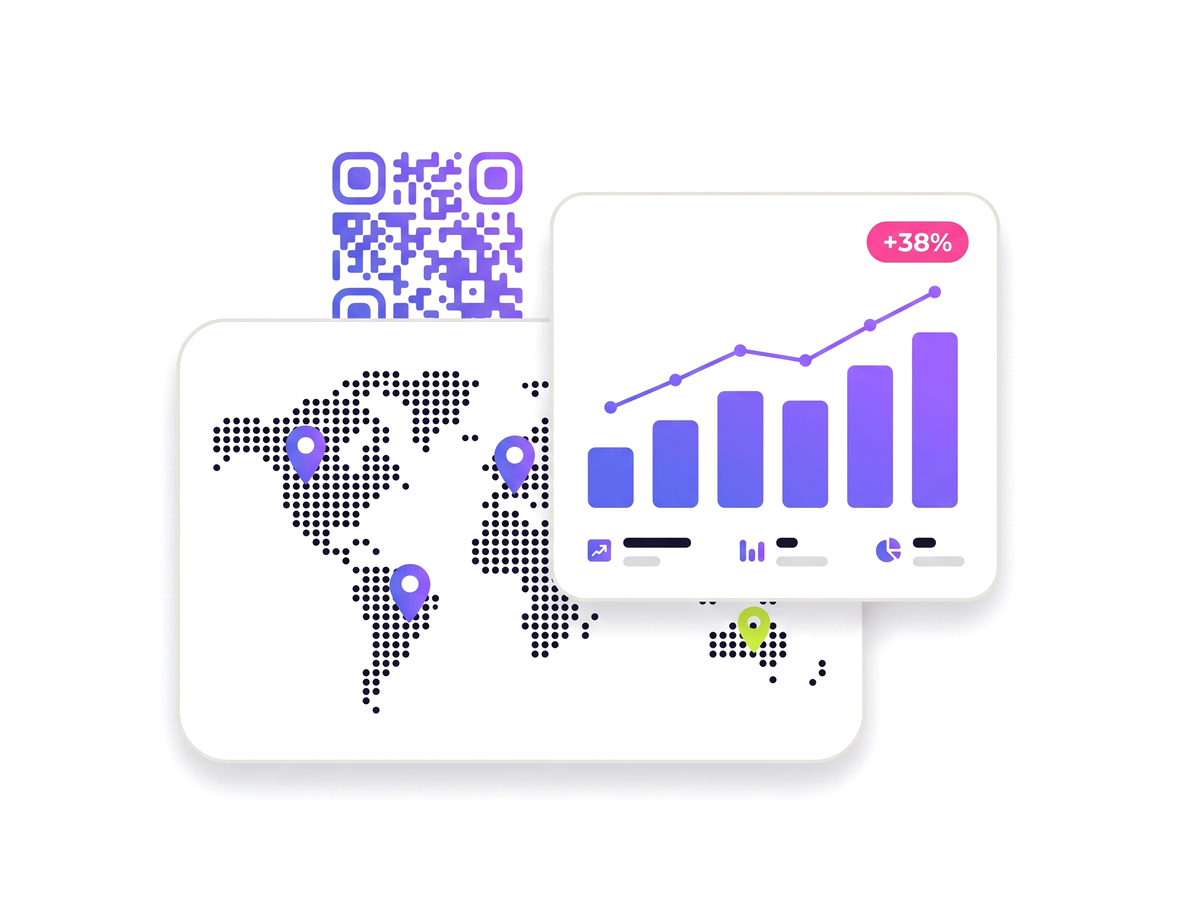
Every scan passes through a redirect we control, which is the moment it can be counted. Here is exactly what gets recorded, what does not, and how to make the numbers answer a question.
Track your first QR code — free
This is the part most comparison articles skip. A static QR code encodes your destination directly: the camera reads the URL out of the pattern and opens it. Nothing of ours is involved, so there is nothing to count. Any generator promising analytics on a static code is either describing a dynamic code by another name, or describing your website analytics.
A dynamic code encodes a short redirect address instead. The phone loads that address, our server records the request and answers with your destination. The extra hop takes a few dozen milliseconds and nobody notices it — and it is the entire reason a scan can be measured.
Which means the decision about tracking is made before printing, not after. A static code already in the wild cannot be retro-fitted with analytics; it can only be replaced.
A scan count that includes robots is worse than no scan count, because it is confidently wrong. Paste a code’s link into a group chat and WhatsApp, Slack and Facebook all fetch it to build a preview — three "scans" from one message nobody has read yet. Uptime monitors add one every few minutes, forever. A crawler that finds the URL can add hundreds in an afternoon.
Every request is classified before it is counted. Link unfurlers, crawlers, monitors, scripted clients and browser prefetches are stored with a reason and kept out of the totals, out of scan notifications and out of webhooks. They are still visible — the dashboard shows how many were filtered — because "the count did not move but 400 bots came through" is itself worth knowing.
The detector is deliberately cautious. An unfamiliar or missing user agent is counted as a person, because discarding a real scan is a worse error than counting a script.
There is no identity behind a scan. No account, no cookie set on the scanner’s phone, no way to recognise the same person returning tomorrow, and no ability to follow them once they have been handed to your destination.
The location is derived from an IP address, which places a scan in a city and no closer — it is routinely wrong on mobile networks, which route traffic through regional gateways. Treat it as "which market", never as "which street".
This is a real ceiling and worth stating plainly rather than discovering later: QR analytics answer questions about placements, not about people. Which poster earns its print run, when scanning peaks, whether the audience is on iOS — all answerable. Who scanned, and whether they came back — not answerable here, and not by anyone else measuring a redirect either.
The redirect stops being able to see anything the moment the phone lands on your site. To learn what happened after that, hand the information over: add UTM parameters to the destination — a source, a medium and a campaign naming the placement — and your web analytics will attribute the session, the pages and the purchase to that exact poster.
The two datasets answer different halves of the same question. Scan counts tell you how many people were interested enough to point a camera; your site analytics tell you how many of them did anything about it. The gap between the two numbers is usually the most useful figure either system produces, because it is a fact about your landing page rather than about your print.
What the feature actually does, part by part.
To the second, so a lunchtime peak on a table card and an evening one on a window are visible rather than averaged away.
Country and usually city, derived from the IP address. Enough to see that the trade show worked; nowhere near enough to identify anyone.
iOS or Android, and which browser. The split decides whether an app-download code should lead anywhere but the store.
Link unfurlers, crawlers, uptime monitors and prefetches are stored and labelled, but never added to your scan count.
One code per poster, table or bag, each with its own history — which is what turns a total into a comparison.
CSV and PDF out, plus a scheduled email so the numbers arrive without anyone remembering to look.
Anyone who has been asked whether the printing was worth it.
The mistake is one code everywhere. The fix costs nothing.
Create a separate dynamic code for each placement — per poster, per table, per bag, per branch.
Name them after the placement rather than the campaign, so the dashboard reads like a map of where they are.
Add UTM parameters to each destination so your site analytics can attribute the visit too.
Leave them for a fortnight. A day of data is noise, and a week still has a weekend in it.
Compare placements, drop the ones nobody scans, and schedule a report so nobody has to remember to check.
Taken from the live plan matrix, so this page and your account always agree.
See the full plan comparison for everything each tier includes.
Straight answers to what usually decides whether this is the right tool for the job.